
Meet an ISC Staff Member – Jason Lasky!
In the continuing series of profiles of some of our staff members, let’s get to know Jason Lasky, our Senior Account Manager!
Read postWe recently dealt with an interesting case of a fleet of BIND 9.16.27
instances running on FreeBSD 12.3. It was reported to us that over a
period of roughly a few days, named processes were exhausting all
available memory on the hosts, causing them to start swapping memory to
disk. The interesting part was that the servers in question were
neither performing recursion (so the ever-increasing memory footprint
could not be attributed to cache bloat) nor subject to a particularly
significant query load. This blog post describes the steps we took to
determine the root cause of this issue and what we found out during that
journey.
We started the investigation by checking whether the increase in memory
use was tracked by BIND 9’s internal memory contexts. These have the
capability to record every allocation made by our own code (down to
file:line tuples). We could use that capability to periodically
collect dumps of allocation data and then look for differences between
them, which would probably allow us to at least determine the part of
the code to take a closer look at. Unfortunately, in this case the
graph of total memory use tracked by libisc memory contexts turned out
to plateau after an initial build-up. This meant that the problem lay
either in the code of one of the external libraries that the BIND 9 code
uses or in the way BIND 9 interacts with these libraries.
Since we did not get similar reports for Linux environments, our first
suspicion was that the root cause was a BIND 9 bug caused by a missing
destructor for some synchronization primitive. One important
distinction between libthr (FreeBSD’s POSIX threads library) and other implementations such as
glibc’s pthreads is that libthr allocates its primitives (mutexes,
condition variables, etc.) on the heap. This means that failing to
invoke a destructor for some primitive (e.g. pthread_mutex_destroy())
at the end of its intended lifetime causes memory allocated for that
primitive to leak. This may ultimately lead to an out-of-memory
condition, particularly if the problem exists on a hot path. This was
exactly what was happening in the case of a bug we fixed
recently. However, that particular problem was already addressed in the
version of BIND 9 running on the affected servers, so we had to look for
other memory leaks of this type in the environment in question to ensure
we had not missed anything.
Quick experiments with Valgrind did not uncover anything suspicious.
Since using Valgrind incurs a significant performance penalty, we also
tried finding memory leaks using a work-in-progress
method of using jemalloc’s leak-checking
capabilities on named. The idea was that
memory could be leaking due to some specific ordering of events, which
never happened when named was running under Valgrind due to the
latter’s significant overhead. This was slightly tricky to implement,
for two reasons:
While jemalloc is the system allocator on FreeBSD, the default
system build does not include support for profiling
(--enable-prof).
Autoconf-based build-time detection of jemalloc is available only in BIND 9.18+.
To work around these obstacles, we built jemalloc from source with
profiling enabled and used LD_PRELOAD to make the runtime linker use
our custom profiling-enabled jemalloc build for memory management,
instead of the one baked into FreeBSD’s libc. This allowed us to
generate call graphs of the functions responsible for creating all
outstanding (not free()d) memory allocations at named exit time.
Unfortunately, analyzing these graphs did not uncover a promising path
forward, either: all reported memory allocations stemmed from early
named initialization and therefore could not contribute to a memory
leak which was growing over time.
While conducting the seemingly fruitless experiments with a
profiling-enabled jemalloc build, we noticed one peculiarity: a ps auxw loop launched in the background was occasionally reporting a weird
sequence of memory-use statistics:
                             USER     PID  %CPU  %MEM       VSZ      RSS  TT  STAT  STARTED     TIME  COMMAND
Thu Mar 31 14:29:53 UTC 2022 named  76113   0.0   1.6   3722832  1074476   0  I+    13:31    0:16.89  /usr/local/sbin/named -g -c /var/named/named.conf
Thu Mar 31 14:29:58 UTC 2022 named  76113   0.0   1.6   3722832  1074476   0  I+    13:31    0:16.89  /usr/local/sbin/named -g -c /var/named/named.conf
Thu Mar 31 14:30:03 UTC 2022 named  76113  28.2   6.4  19557584  4273736   0  I+    13:31    0:20.24  /usr/local/sbin/named -g -c /var/named/named.conf
Thu Mar 31 14:30:08 UTC 2022 named  76113  23.2   1.6   3844268  1100952   0  I+    13:31    0:21.65  /usr/local/sbin/named -g -c /var/named/named.conf
Thu Mar 31 14:30:13 UTC 2022 named  76113  12.5   1.6   3844268  1101004   0  I+    13:31    0:21.65  /usr/local/sbin/named -g -c /var/named/named.conf
Around 14:30:03, over a period of just a few seconds, VSZ jumped from about 3.5 GB to about 18.5 GB, RSS jumped from about 1 GB to about 4 GB, and then both values dropped down to almost their previous values; yet memory use in the “new stable state” was visibly higher than before that event.
Looking closer at the ps output history, we quickly noticed that such
events were happening at 15-minute intervals, which we tracked down to a
cron job collecting named statistics from
http://localhost:8053/json. We ran the same ps output collection
process without LD_PRELOAD affecting named (i.e. using the stock OS
allocator) and the periodic jumps in memory use were still happening:
                             USER     PID  %CPU  %MEM       VSZ      RSS  TT  STAT  STARTED     TIME  COMMAND
Thu Mar 31 14:44:57 UTC 2022 named   5831   0.0   0.6    616092   417880   0  I+    14:36    0:00.72  /usr/local/sbin/named -g -c /var/named/named.conf
Thu Mar 31 14:44:59 UTC 2022 named   5831   0.0   0.6    616092   417880   0  I+    14:36    0:00.72  /usr/local/sbin/named -g -c /var/named/named.conf
Thu Mar 31 14:45:01 UTC 2022 named   5831   2.2   0.8    711020   503780   0  I+    14:36    0:00.96  /usr/local/sbin/named -g -c /var/named/named.conf
Thu Mar 31 14:45:03 UTC 2022 named   5831   1.5   0.8    711020   503780   0  I+    14:36    0:00.96  /usr/local/sbin/named -g -c /var/named/named.conf
Thu Mar 31 14:45:05 UTC 2022 named   5831   1.1   0.8    711020   503780   0  I+    14:36    0:00.96  /usr/local/sbin/named -g -c /var/named/named.conf
So what transpired during the statistics collection process that was causing such shifts in memory use? Flame graphs to the rescue!
We used a slightly tweaked dtrace invocation suggested
by Brendan Gregg for collecting on-CPU stack traces for a process of
choice:
dtrace -x ustackframes=100 -n 'profile-1000 /execname == "named" && arg1/ { @[ustack()] = count(); } tick-2s { exit(0); }' -o out.stacks
We ran the above command while a curl fetch collecting JSON statistics
was running. The resulting out.stacks file was post-processed using
stackcollapse.pl and passed to
flamegraph.pl, which produced the following image:
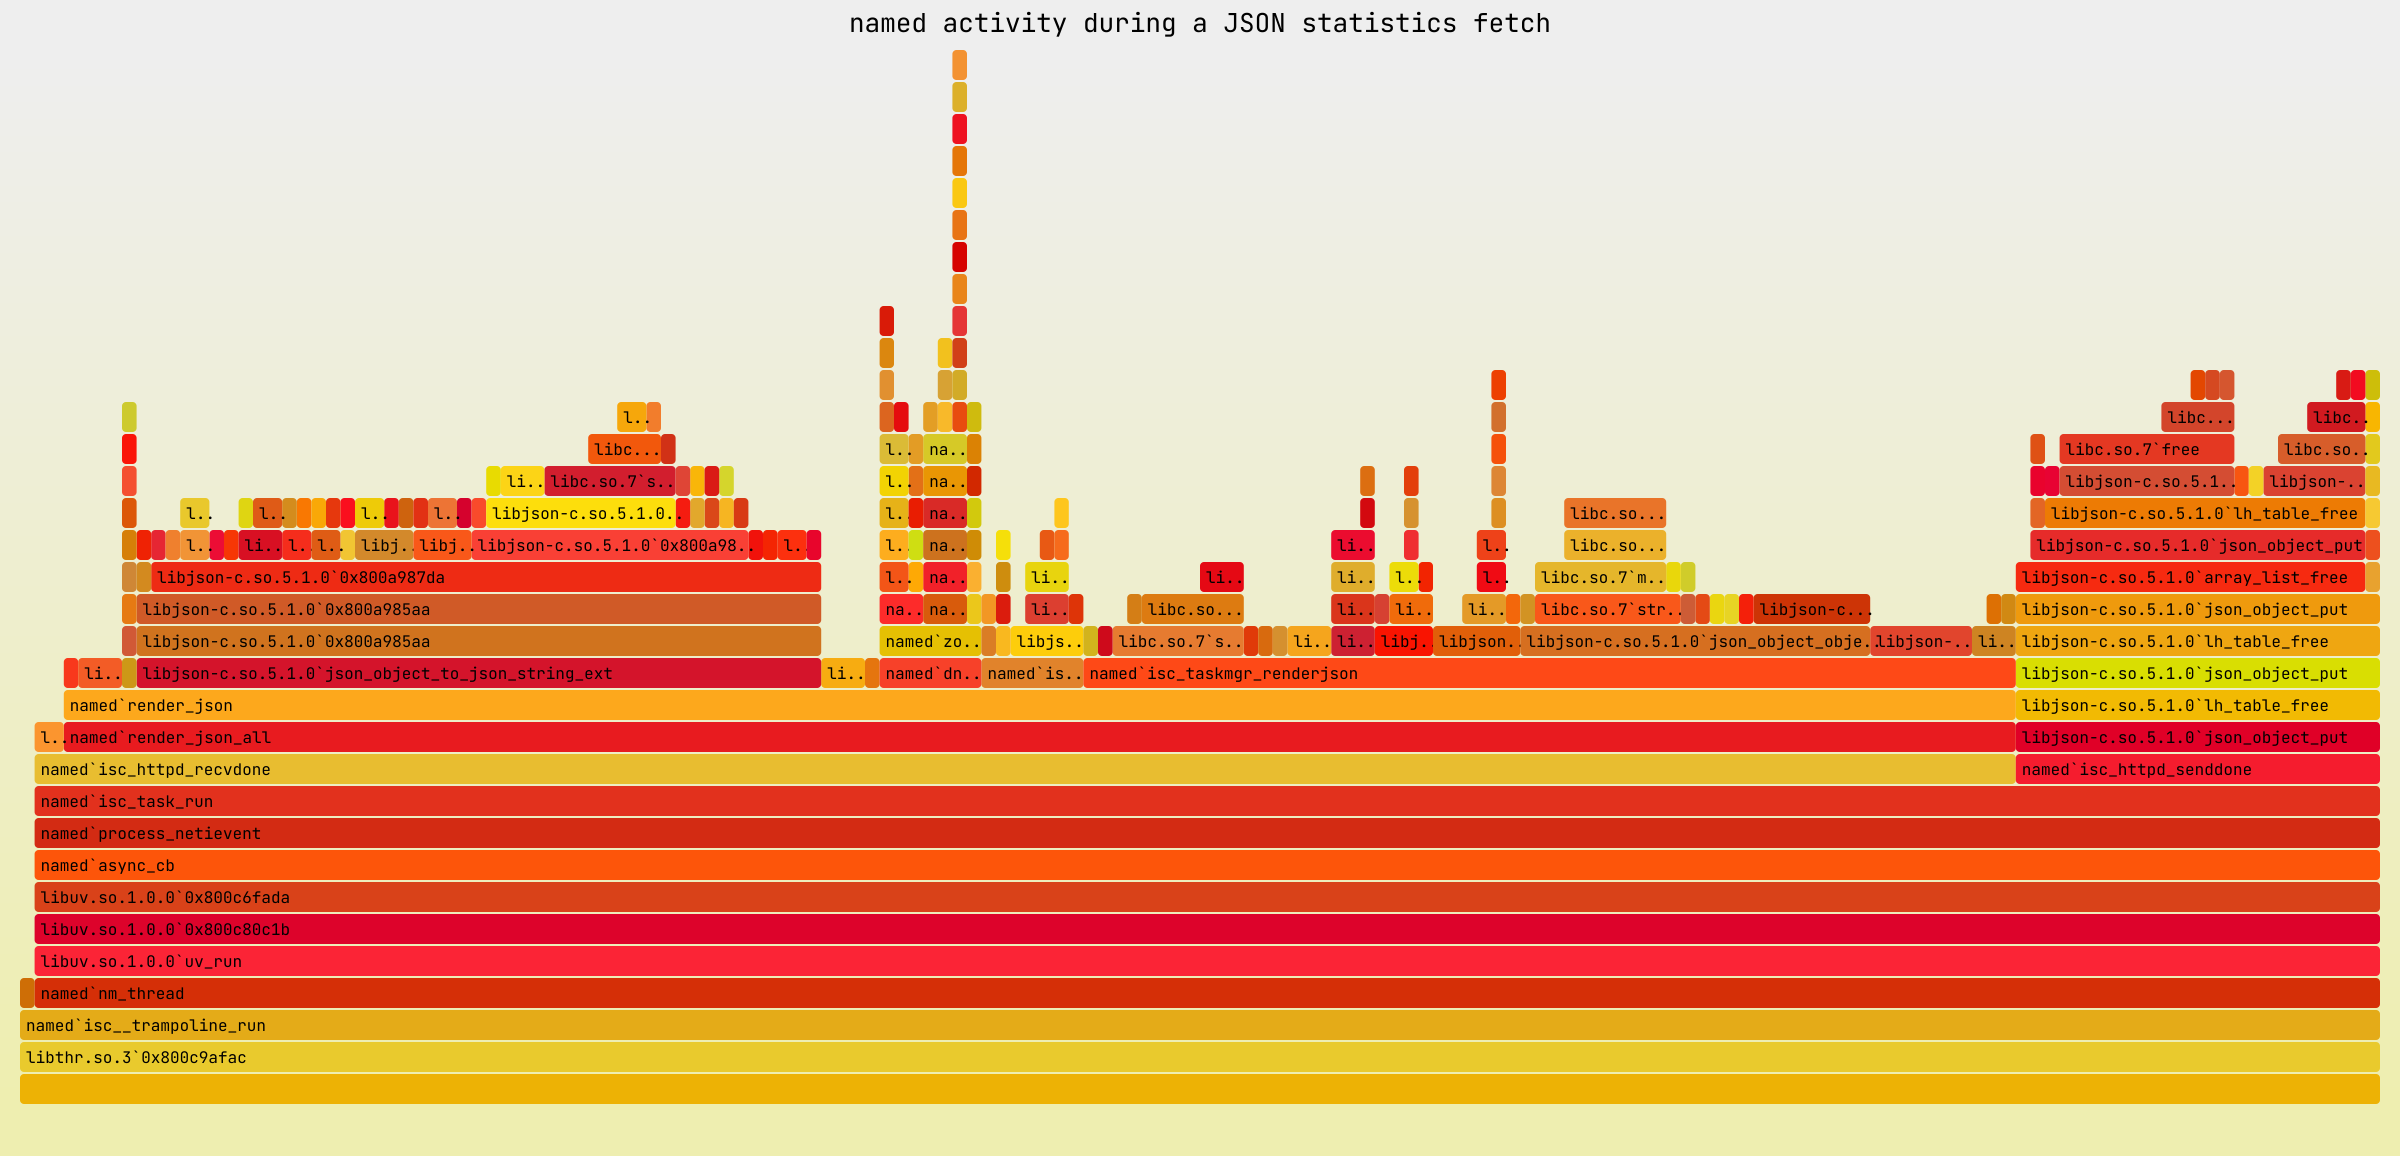
This immediately pointed at isc_taskmgr_renderjson() as the primary
suspect. That function was present in 40% of all named stack traces
collected during the profiling period.
Another thing that drew our attention was the huge presence of functions
related to memory management in the flame graph. Freeing a JSON object
taking 15% of all CPU time assigned to named? Something had to be
wrong there. Before moving forward, we decided to simplify the graph a
bit by removing shared object names from the labels, cutting off the
stack traces at all libc functions related to memory management, and
marking such cuts with contrasting colors:
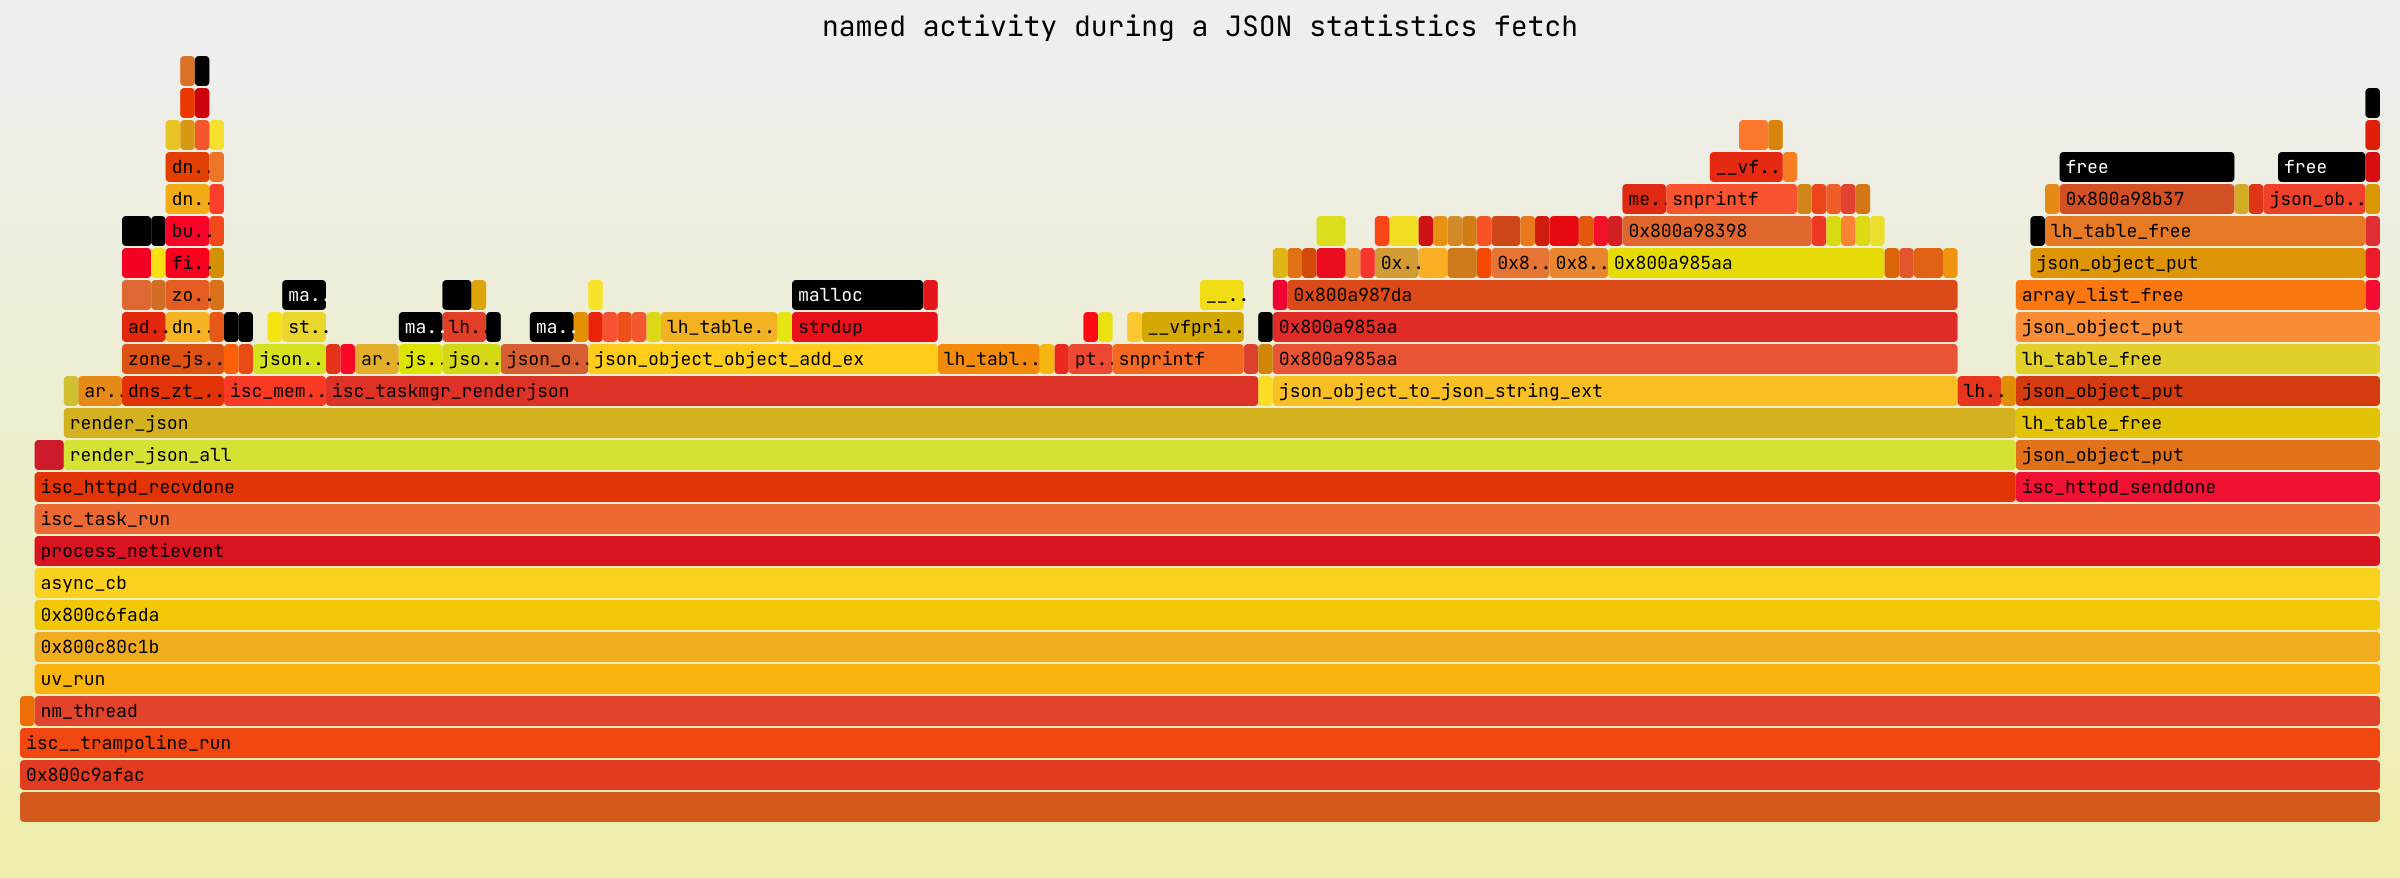
This emphasized how omnipresent memory management functions were in the
profile: in total, about 30% of all CPU time assigned to named during
the profiling period was spent in either malloc(), calloc(), or
free(). That is a lot of time to spend purely on memory management.
We resumed our investigations by going back to
isc_taskmgr_renderjson(), the function responsible for producing task
manager statistics. A quick glance at the JSON object returned by
named on a host with 32 logical CPUs confirmed that the task manager
statistics were quite huge - and indeed by far the largest component of
the statistical data:
$ curl -s http://localhost:8053/json | jq -c | wc -c
4106028
$ curl -s http://localhost:8053/json | jq -c ".taskmgr" | wc -c
3599300
Task manager statistics are nothing else than a list of task objects,
each of which has just a few integer/string fields attached to it.
So… what is using so much space? Exactly how many tasks are there in
a named instance running on a 32-CPU machine?
$ curl -s http://localhost:8053/json | jq ".taskmgr.tasks | length"
36897
Whoa, that’s a lot of tasks. Since each of them has a name which describes its purpose and therefore also identifies the piece of code which created it, we took a look at which types of tasks were the most prevalent ones:
$ curl -s http://localhost:8053/json | jq ".taskmgr.tasks[].name" | sed -E "s|res[0-9]+|res<number>|" | sort | uniq -c | sort -n
      1 "ntatable"
      1 "server"
      1 "zmgr"
      2 "ADB"
      2 "cache_dbtask"
      2 "resolver_task"
      2 "statchannel"
      2 "view"
     10 "loadzone"
     10 "zone"
   2048 null
   2048 "res<number>"
  32768 "udpdispatch"
The high count of udpdispatch tasks (which scales linearly with the
number of CPUs available on the host) obviously stands out. It is a
known issue in BIND 9.16 and older versions; in BIND 9.18, the dispatch
code was reworked from the ground up. One of the results
of that huge refactoring effort was dropping dedicated udpdispatch
tasks altogether, as their high counts were not translating to improved
performance in any way. Let’s estimate the amount of memory-related
work required to produce JSON statistics on a 32-CPU host: each of the
~37,000 task objects included in JSON statistics has three string fields
and three integer fields. Each of these fields is a JSON object, so a
quick back-of-the-envelope calculation suggests that there are at least
200,000 memory allocations happening for every JSON statistics fetch on
a 32-CPU machine. That explained why a profiling-enabled jemalloc build
needed tons of space to store the stack trace for every single
allocation. But that’s not all - after being allocated, the primitive
objects then have to be put together into one large object, which then
in turn needs to be serialized. And finally, all of those objects have
to be freed, which also does not happen instantly.
The simplest workaround for this problem was not to use the “catch-all”
/json URL, instead relying on other URLs allowing more
granular access to JSON statistics (to avoid generating task manager
statistics altogether). We could end the story here, but “just do not
use this feature” is not the best response to give to a user reporting a
problem. Also, if the JSON objects are properly destroyed after they
are sent to the client, how could this be the root cause of a long-term
problem?
While some of the techniques we used to investigate the problem up to
this point (e.g. building a library from source) may not be possible to
employ in every production environment, all of them could at least be
applied to a live named instance serving real traffic. To get to the
bottom of what was happening, we needed to be able to reproduce the
problem in an environment allowing free experimentation (using
debuggers, experimental code changes, etc.).
Interestingly enough, we quickly managed to reproduce the problem in a
FreeBSD 12.3 QEMU VM with 32 virtual CPU cores, but not on Linux (where
BIND 9.16 binaries were forcibly linked with jemalloc using a
configure.ac hack), not even when we forced use of the same build-time
options on Linux as for the default FreeBSD system build. The behavior
we observed on Linux was that as named processed numerous requests for
JSON statistics, its memory use increased over time, but not as quickly
as on FreeBSD and, most importantly, not indefinitely.
To examine more detailed data than just ps output, we added
malloc_stats_print() calls to named and tried
to determine which counters reflected the ps-reported VSZ/RSS values.
It quickly turned out that the number of dirty pages for a specific
jemalloc arena was correlated with the values reported by ps. Over
time, the value of that counter was increasing in a seemingly unbounded
manner on FreeBSD, but not on Linux.
Even without knowing what was happening behind the scenes, this
discovery was substantial because it led us to the first practically
feasible solution for the problem. Our line of thinking was: if the
infinite memory use growth is caused by unbounded amassing of dirty
pages, can we somehow prevent it from happening? Browsing the jemalloc
documentation, we came across the dirty_decay_ms
option, which looked promising:
Approximate time in milliseconds from the creation of a set of unused dirty pages until an equivalent set of unused dirty pages is purged (…) and/or reused. Dirty pages are defined as previously having been potentially written to by the application, and therefore consuming physical memory, yet having no current use. (…) A decay time of 0 causes all unused dirty pages to be purged immediately upon creation. (emphasis added)
We confirmed that starting named with the MALLOC_CONF environment
variable set to dirty_decay_ms:0 causes memory use to remain stable.
This solution could be successfully deployed with the stock FreeBSD
system allocator and precompiled BIND 9 binaries - no patching was
required anywhere. It looked elegant, but… if it was really as
gorgeous as our complacent selves thought it was, why would
dirty_decay_ms not be set to 0 by default by jemalloc itself?
The catch is that not retaining any dirty pages (in other words,
immediately returning all dirty pages to the operating system upon their
creation) hinders performance because it prevents dirty pages from being
recycled for subsequent allocations, increasing the allocator’s system
call footprint. So while this fix was acceptable in our specific use
case, it was not necessarily feasible in the general case (e.g. under
more significant load). That conclusion posed a different question:
why were the dirty pages in named not purged over time, as promised
by jemalloc’s documentation? A bug like this just had to have been
triggered somewhere, somehow, by someone before, right?
Since named is a non-trivial piece of software, we wanted to strip the
problem down to the bare basics, hoping to be able to better understand
jemalloc’s behavior in a simpler application. To that end, we wrote a
C program which naïvely mimics what named does in
isc_taskmgr_renderjson(): each time a signal is received, one of the
threads spawned by the program creates a JSON object comprised of tens
of thousands of other JSON objects, serializes that object, and then
frees it; jemalloc statistics are output after every iteration.
Unfortunately, this program was not able to trigger infinite memory use
growth on any operating system we tried it on. This meant that there
was some difference between the way jemalloc behaved for this program
and for named. Following this lead, we once again resorted to
comparing malloc_stats_print() outputs for our sample application and
for named. Both on Linux and FreeBSD, one difference became striking
after a few dozen iterations. This is a sample excerpt from
malloc_stats_print() statistics for a single jemalloc arena in named
running on Linux:
decaying:  time       npages       sweeps     madvises       purged
   dirty: 10000        17625            0            0            0
   muzzy: 10000            0            0            0            0
and this is a corresponding sample from our attempt at a reproducer:
decaying:  time       npages       sweeps     madvises       purged
   dirty: 10000        10715           17           53        19299
   muzzy: 10000           27            7           17         9542
As you can see, in our sample program, dirty pages were clearly being
purged over time, as expected. But in named, even on Linux, where the
dirty page count was not growing indefinitely, it seemed that jemalloc
was not returning any dirty pages to the operating system.

rr, or There and Back AgainTo learn what jemalloc code paths are taken when dirty pages are purged,
we captured an rr recording of our sample program and used a
data watchpoint set on the purged counter, combined with the power of
reverse execution, to understand the logic behind the process. That
allowed us to determine that in jemalloc 5.1.0 (which is the version
used in FreeBSD 12.3), in order for arena decay (i.e. dirty page
purging) to be triggered, a so-called “ticker” has to fire. A
ticker is a simple construct that jemalloc uses to ensure that certain
actions are taken “once every N times” (e.g. “try purging some dirty
pages once every 1000 (de)allocations”). Apparently these tickers were
not firing during JSON statistics generation in named. Why? rr to
the rescue again!
To our astonishment, while we were capturing an rr recording of
named on Linux, the counter of dirty pages started significantly
growing with each curl request, just like it originally did on
FreeBSD! Hooray? We had no idea why that happened, but we first
focused on figuring out why the tickers were not firing - fortunately,
the number of purged dirty pages remained at 0 even under rr. After
all, with a captured rr recording of what looked like a successful
reproduction of the original issue, we could just get back to exploring
that angle later on (which we did).
Going back and forth through both rr recordings, we ultimately reached
a surprising conclusion: some ticker structures were never initialized
by jemalloc in named. Further analysis of the code paths involved led
us to an explanation of that phenomenon: the threads that did not have
their ticker structures initialized were the ones which called free()
before issuing any *lloc() call. This can be the case with e.g.
named’s worker threads: they loop over event queues, executing
callbacks as events are posted to them, and it is common for an event
callback to free the event structure associated with it. That happens
e.g. during named startup, when the so-called task-exclusive mode
(which, by the way, is also being removed from
BIND 9) is entered early in the process in order to load DNS zones;
doing that involves pausing most worker threads, which the network
manager achieves by posting “pause” events to worker threads’ event
queues. Each worker thread then processes the “pause” event and
frees it afterward.
In short, we learned that if a thread starts with a free(), it becomes
incapable of ever triggering dirty-page purging during its lifetime.
Note that purging (returning dirty pages to the operating system) is
not the same thing as recycling (reusing dirty pages for subsequent
allocations before returning them to the operating system). On Linux,
dirty-page recycling was efficient enough to keep memory use in check in
the long term. On FreeBSD, it was not (more on that below). However,
jemalloc was affected by the broken dirty-page purging issue on both of
these systems.
To confirm our findings, we tweaked our sample program slightly, so that
each of its threads started with a free():
diff --git a/reproducer.c b/reproducer.c
index 494d05e..666f9a1 100644
--- a/reproducer.c
+++ b/reproducer.c
@@ -14,8 +14,12 @@
 #define THREADS_TO_CREATE 4

 static bool done;
+void *dummy;

 void generate_json(void) {
+	free(dummy);
+	dummy = malloc(sizeof(dummy));
+
 	json_object *root = json_object_new_object();
 	assert(root);

@@ -108,6 +112,8 @@ int main(void) {

 	fprintf(stderr, "PID: %d\n", getpid());

+	dummy = malloc(sizeof(dummy));
+
 	setup_threads(threads);
 	setup_signals();
With that change in place, lo and behold, the malloc_stats_print()
statistics reported by our sample program started looking like this:
decaying:  time       npages       sweeps     madvises       purged
   dirty: 10000        11253            0            0            0
   muzzy: 10000            0            0            0            0
This issue was reported to jemalloc developers, but
not before we found out that it was inadvertently fixed
in jemalloc’s dev branch by moving the ticker state to a different
structure. However, that fix is not yet present in any numbered
jemalloc release (the latest one being 5.2.1 as of this writing), though
it will be included in the upcoming 5.3 version.
Knowing that an upstream fix is in the pipeline is good, but it is not much consolation to all the existing deployments out there in the wild that are affected by this issue. To help with that, we prepared a workaround which forces each worker thread to perform a dummy memory allocation at the beginning of its lifetime. That workaround will be included in BIND 9.16.29.
Note that while this problem was discovered in BIND 9.16 running on FreeBSD, analyzing its nature uncovered that it also affects BIND 9.18+ binaries linked with jemalloc on other platforms. We have not yet received any reports about similar issues with BIND 9.18 - and given that this problem will also be worked around in BIND 9.18.3+, hopefully we never will!
The one burning question that was left unanswered was this: how come we
managed to trigger the issue on Linux under rr, but not without it?
One of the limitations of rr is that it emulates a single-core
machine, which caused jemalloc to allocate just a single arena for all
named worker threads. Knowing this, we were able to reproduce
FreeBSD-like jumps in memory use after each curl request on Linux
without rr by setting the MALLOC_CONF environment variable to
narenas:1, emulating what happens when named is run under rr.
But… if this change is necessary to trigger the problem, then why was
it originally noticed on FreeBSD, where named uses multiple jemalloc
arenas? It’s… complicated. The answer lies in the nitty-gritty,
OS-specific details of how jemalloc recycles dirty pages when
realloc() calls are issued for large extents. (This is what the
json-c library does when it converts an in-memory
representation of a JSON object to a string. Specifically, it resizes
the target buffer to twice its current size each time it runs out of
space. Given that serialized JSON statistics are several megabytes
large for hosts with numerous logical CPUs, the serialization process
causes realloc() to be called with several-megabytes-large target
sizes.) One example difference between Linux and FreeBSD is that on the
former, jemalloc prefers to retain dirty pages when
it would normally give them back to the kernel on other operating
systems. But there are more subtleties involved in the process that
could easily take a separate article to describe; suffice it to say that
we did manage (albeit very rarely) to observe several-megabytes-large
(FreeBSD-like) jumps in memory use after a single curl request on
Linux - they just do not happen as often there as on FreeBSD.
udpdispatch TasksWhile investigating this issue, we employed a variety of techniques for debugging memory-use issues in BIND 9. We also learned quite a bit about how jemalloc works and how to interpret its arena statistics, which will certainly pay off the next time we have to investigate a similar issue. We also found out that one of the factors contributing to the problem (a huge number of tasks created on certain types of hosts) is already gone from newer BIND 9 versions, which reassures us that our continuous refactoring efforts are worth their non-trivial cost in the long term. Back to work, then!
What's New from ISC

In the continuing series of profiles of some of our staff members, let’s get to know Jason Lasky, our Senior Account Manager!
Read post
ISC is excited to announce the release of Kea 3.2.0, a new stable version!
Read post