Meet an ISC Staff Member – Jason Lasky!
In the continuing series of profiles of some of our staff members, let’s get to know Jason Lasky, our Senior Account Manager!
Read postNetwork Interface Cards (NICs) often maintain multiple queues for transmitted and received packets and the Linux operating system kernel can be tuned to have each queue handled by a specific CPU core. To obtain peak performance from a network service on modern multicore computer systems, it’s desirable to ensure a balanced workload on each NIC queue and CPU core.
The NIC drivers on Linux typically contain statistics that show the total number of packets and bytes transmitted and received. These can be accessed using the ethtool command, e.g. ethtool -S enp5s0f1. The drivers actually maintain a very large number of statistics, so to get at just the queue statistics you might use something like this:
$ ethtool -S enp5s0f1 | grep '[rt]x-[0-9]'
  tx-0.tx_packets: 61122861442
  tx-0.tx_bytes: 10359359292618
  rx-0.rx_packets: 165894101718
  rx-0.rx_bytes: 12865093535024
  tx-1.tx_packets: 72709177633
  tx-1.tx_bytes: 11351345564539
  rx-1.rx_packets: 18640137236
  rx-1.rx_bytes: 1462729691538
  ...
However, it’s far from easy to turn these total numbers into a real-time display of your NIC queues.
To solve this, I’ve written and published a new tool called ethq. On supported NICs, every second it reads the NIC queue statistics and converts the absolute values into bytes per second and packets per second values for each queue. It also generates total Mbps figures. Think of it as top for your NIC!
Here’s what an unbalanced set of queues looks like:
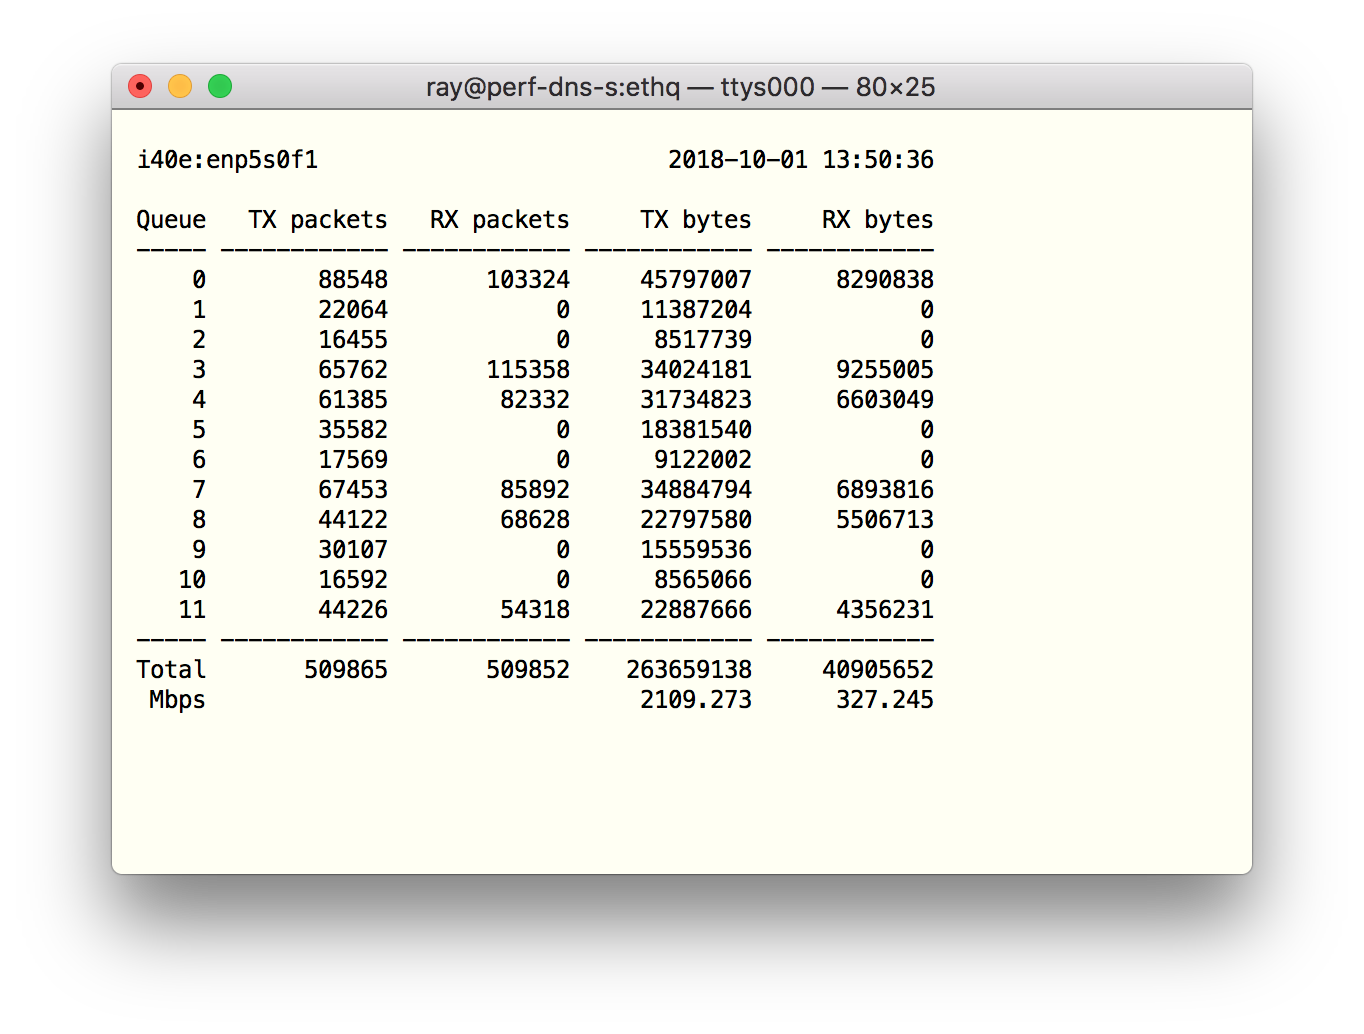
In this case the imbalance is primarily caused by there being an insufficient number of traffic sources to correctly exercise the flow hashing algorithm in the NIC which distributes packets to queues based on fields such as the IP source address and UDP source port. The imbalance is further exacerbated by poor CPU core affinity between the CPU cores that are handling each inbound queue and the server daemon threads that subsequently process each packet.
Here is a much better balanced set of queues:
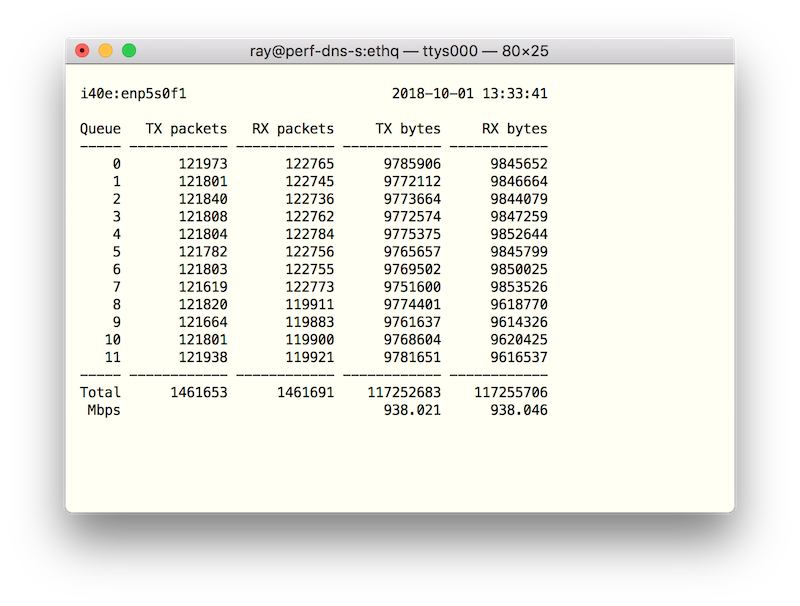
In this case there are many thousands of traffic sources, and the network server (which in this case is just echoing the received packets) is using raw sockets configured using the PACKET_FANOUT_CPU option to keep traffic localised to the CPU core that received it.
Getting the code
The code is on our GitHub page at https://github.com/isc-projects/ethq.
Compiling the code will require that you have the development headers and libraries for ncurses installed.
NIC Support
Because there’s no standard for the format of the names of the per-queue statistics variables (e.g. tx-1.tx_packets), the software currently only supports a limited set of NIC drivers: i40e (e.g. Intel X710), ixgbe (e.g. Intel X540) and vmxnet3 (VMware virtual NICs).
If you have a multiqueue NIC that isn’t yet supported, please file an issue on the project’s Github page including the output of ethtool -i and ethtool -S from your NIC.

What's New from ISC

In the continuing series of profiles of some of our staff members, let’s get to know Jason Lasky, our Senior Account Manager!
Read post
ISC is excited to announce the release of Kea 3.2.0, a new stable version!
Read post