How to report a security vulnerability, 101
At ISC, we sincerely value the contributions of our users, and security researchers, who analyze and probe our software for vulnerabilities.
Read postNow that the latest version of BIND 9 has been released, it is worthwhile to look at the performance enhancements that have taken place over the past couple of years.
As part of the development cycle of BIND, we carry out a set of performance tests. Our performance laboratory system (somewhat unimaginatively called “perflab”) is continually cycling through all configurations registered with it, building BIND and running a performance test. (Details of the system have been presented elsewhere (e.g. https://www.isc.org/docs/bellis-oarc-perflab.pdf) so it will not be described here.) In this way, as the development branches are updated with changes, the effect of those changes on performance is quickly visible.
Among the configurations tested, the following are especially important:
2021 Update: We are working on a new approach to testing recursive performance that should be a better reflection of real-world resolver performance, using captured real queries. We are not confident that the results shown below for resolver performance are predictive of what you will see in a live deployment.
For each scenario, the query set is one that will result in about 5% NXDOMAIN responses (with the exception of the root zone test, where the query set was taken from a real traffic stream, and contains about 2.8% NXDOMAINs).
To obtain a figure for the query rate that BIND can handle, perflab starts up the server under test. It then fires queries at it for 30 seconds and calculates a query rate. This 30-second measurement is repeated 30 times and a figure for the query rate (and standard deviation) is calculated. The first measurement is discarded from calculations. For recursive measurements, this allows the cache to be filled and so subsequent tests are measuring the same thing - the time taken to get a name from cache. But for all tests, it also allows the server to settle down - for all data structures to be created and reach their final size.

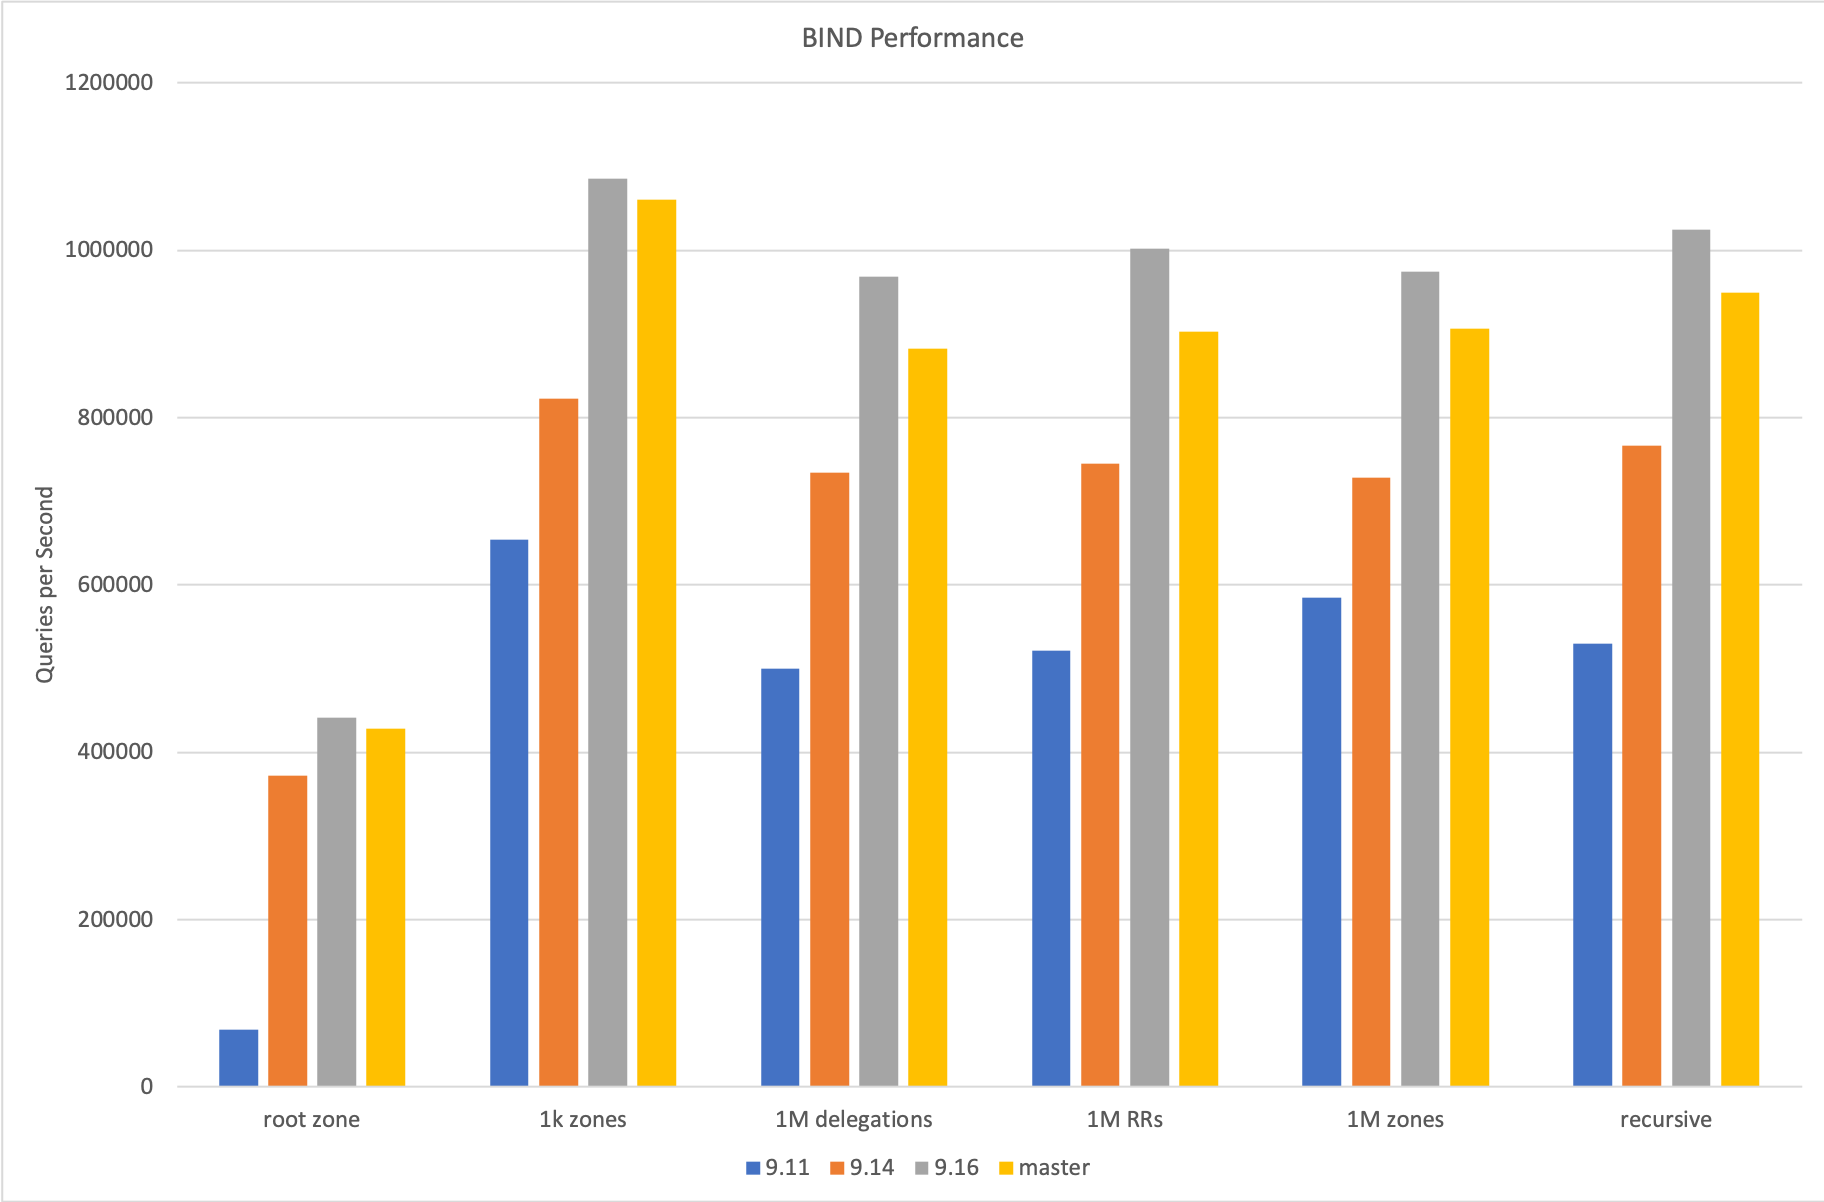
The series of measurements presented here is taken from those of current development branches, at a point a few days after the current set of releases was generated. Also included are the results for the 9.14 series, which (at the time of writing) has just reached its end of life; this is no longer actively tested, so the results here are from the last measurements taken, after the release of 9.14.11.
The graphs clearly show the improvement in performance from 9.11 through 9.14 to 9.16. Significant investment in performance improvements began in work for 9.12, where the removal of the old “additional cache” and the introduction of a new “glue cache” vastly improved performance in delegation-centric zones. Since then, a lot of work has been put into the refactoring of the network code. BIND was written in the days of slower machines and slower networks, and the model that suited it well then was in need of update. So 9.16 introduced the updated network manager, which as well as improving performance has made that area of the code more maintainable.
Since the release of 9.16 there have been further internal changes that are still being assessed; the most recent changes appear to have led to a small decrease in performance of the main branch (from which the 9.17 releases are taken). This will be the subject of investigation over the months to come.
What's New from ISC