
BIND Authoritative Performance on Multi-core Systems
A 2025/26 grant from the Nominet DNS Fund enabled ISC to purchase new computers for our ten-year-old Perflab performance test bed.
Read postA 2025/26 grant from the Nominet DNS Fund enabled ISC to purchase new computers for our ten-year-old Perflab performance test bed. This blog reports the first results from the updated test bed.
To test authoritative workloads, ISC set up a laboratory for performance testing (Perflab). Each machine in Perflab has one of three roles:
We test several configurations in a round-robin fashion, among them:
Historically, we ran our tests on machines from 2016, whose setup is described here.
While these machines have served us well, they are showing their age: the servers have only twelve cores, while recent CPUs can have hundreds, and taking advantage of such core counts is challenging.
Thanks to the funding from Nominet, we were able to renew our performance lab with five new machines:
Each server has ninety-six cores, letting us properly test BIND’s scalability on machines with a high core count.
How did BIND scale as the number of cores increases? Let’s limit how many CPUs BIND can use with the taskset utility, and graph performance against core count.
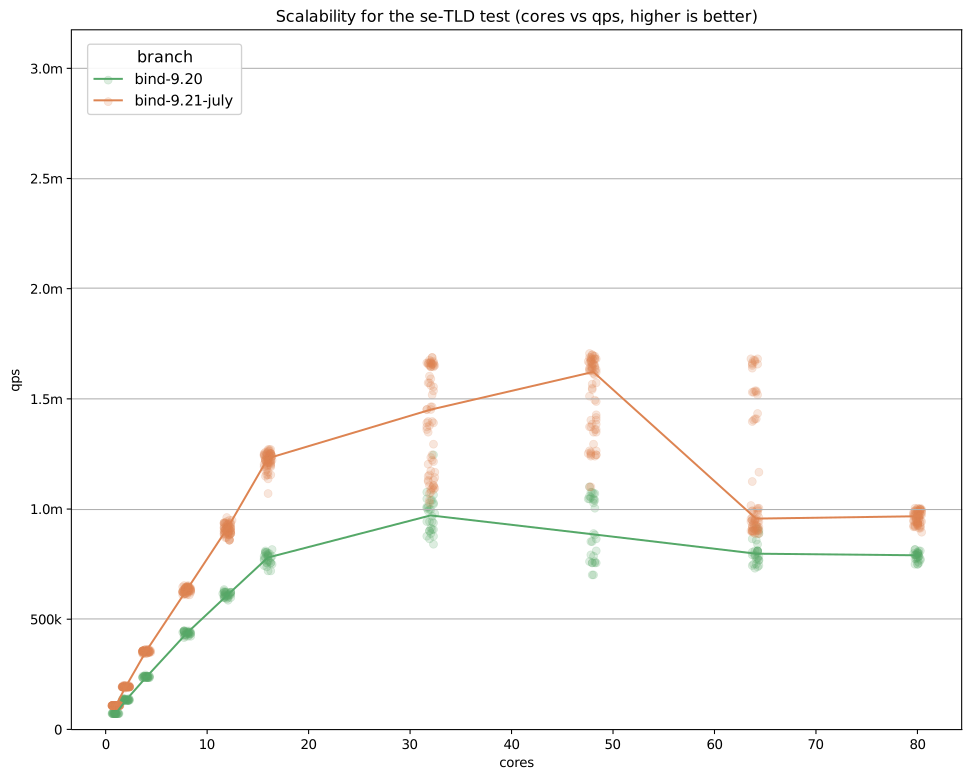
We see two things:
BIND scales poorly beyond sixteen CPUs. This is true both of 9.20 and the July release of 9.21. On the positive side, 9.21 shows greatly improved performance compared to 9.20. With this in mind, we looked for ways to improve BIND’s scalability.
To see why multiple cores are hard to exploit, let’s set BIND aside and look at a much simpler program: it increments a counter in a loop for one second, then reports how many increments it managed.
This is purely compute-bound, so we’d expect it to scale linearly: doubling the cores doubles the compute power, which should double the reported count. Running it shows something very different:
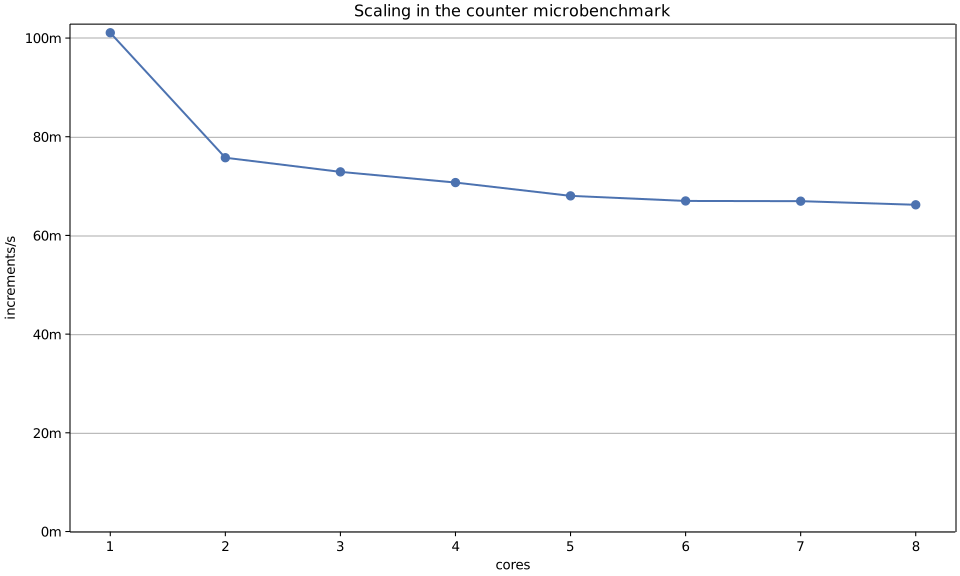
Why does adding cores hurt performance? Incrementing the counter means reading the previous value first, which requires coordinating with the other cores. That coordination cost dominates: the more cores there are, the more time-consuming it gets.
BIND handles zone transfers concurrently with queries. When new data comes in, it cannot free the old data immediately; it must first finish serving all queries that were referencing the old data. To achieve this, each zone has a counter of how many in-flight queries are referencing it. The counter is incremented when the query arrives, and decremented once the answer is sent.
This counter is a reference counter — a common pattern for tracking data that’s in use by more than one thread at a time.
This is the same coordination problem as our counting example, and it’s the main cause of BIND’s poor scalability.
To improve things, we focused on reducing the number of times we update counters during a query. We found that there were some redundant updates in the query mechanism.
To see why, let’s look at the query mechanism:

BIND used to share several code paths between authoritative and recursive query handling (highlighted in yellow in the graph). Recursive answers could blend data from several sources — cache, local zones, mirror zones — so the path had to bump a reference counter for each one. Authoritative answers reused this same path, but had only one real source. That source ended up listed more than once and its counter bumped multiple times in a single query.
We found two such instances of redundant adjustments. Introducing a specialized path for the authoritative case led to an increment in QPS in our testing.
Another instance where we’ve been able to remove reference counting is query names. As an optimization, BIND avoided copying query names out of the zone database, using a reference count instead.
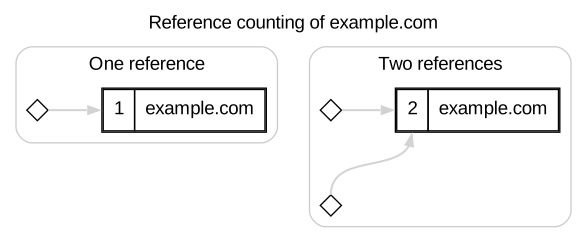
For small core counts, this yielded minor savings (around 1% in our old setup), but on a machine with a high core count it turns out to be a pessimization.
Giving each query its private copy can yield up to 50% improvement in query rate when the same name is looked up repeatedly.
It is not just zones that need reference counting. BIND keeps track of the network interfaces available on the server, and can dynamically open or close new listening sockets as they change.
A query must be answered on the same interface and socket it was received on. As with zones, each interface keeps a count of how many in-flight queries reference it. This count is shared by all threads, creating the same scalability problem.
We applied the same fix as for query names: giving each thread its own copy removed the shared counter entirely. This led to improvements across the board, including a 38% increase in query rate in the million small zones synthetic test.
To understand the final optimization, we need one more aside. Let’s modify our toy program: this time, two threads increment separate counters, but we vary where in memory those counters live.
The graph below shows increments per second as a function of how far apart the counters are. For reference, it also includes the single- and two-thread results from the original toy program.
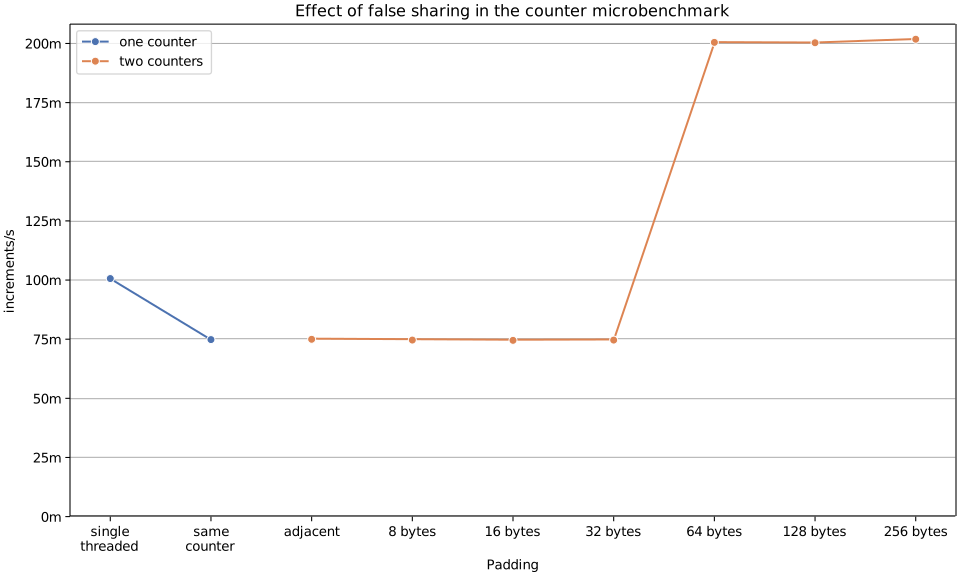
Surprisingly, location matters: incrementing two nearby counters is nearly as slow as incrementing the same one.
This is a phenomenon known as false sharing. A full explanation is beyond the scope of this post, but here’s the short version: most modern CPUs, including ours, load and track data in blocks of 64 bytes called cache lines, and two counters sharing a block interfere with each other even without overlapping.
We’ve seen why we need to protect zone databases with reference counting, but that is not enough. Reference counting still allows this race condition:
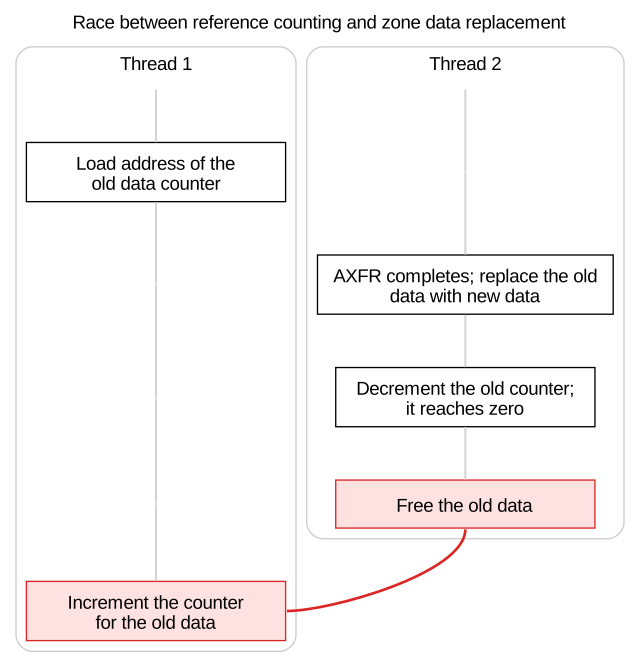
To prevent this race, we use a mechanism called a reader-writer lock. Locks are also implemented using special counters.
We had already taken care to avoid false sharing between reference counters, and separately, between locks. We hadn’t considered the two together, until we found two places where a lock and a reference counter shared a cache line.
By addressing this additional case, we were able to improve query rate by 3.4% in our testing with the .se zone.
Do the improvements above help? Turns out, yes:
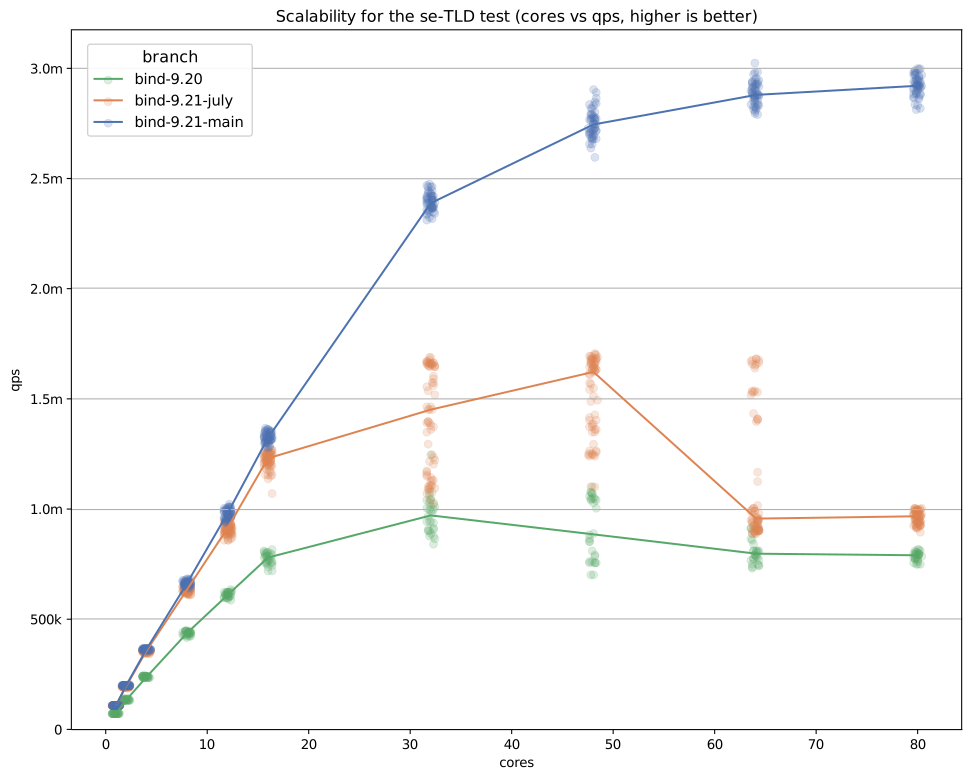
These improvements have been merged into the current development branch and will be part of the next stable release, BIND 9.22. Going forward, we will continue to use the Perflab for regular performance testing for authoritative systems, as well as further experimental efforts to improve performance. With this new hardware, we can now extend the testing we have been doing to cover scalability with modern equipment.
What's New from ISC

A 2025/26 grant from the Nominet DNS Fund enabled ISC to purchase new computers for our ten-year-old Perflab performance test bed.
Read post
Kea 2.6 reached the end of maintenance with the release of Kea 3.
Read post